Top 10
Creates a Pie Chart showing the 10 most common items by count for a single column in the Data Set.
The easiest way to create a Top 10 report is to 'drag and drop' a Data Set onto the Top 10 action on the sidebar. This eliminates the need to choose a Data Set for the report.
Or, click the Top 10 action on the side bar. A file dialog will appear to choose a Data Set for the report.
Next, choose a field for the report:
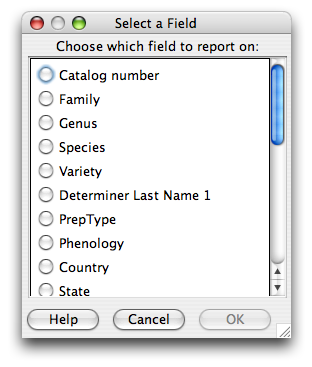
Select a Field
Select a column and click 'OK'. The report will open in the work space.
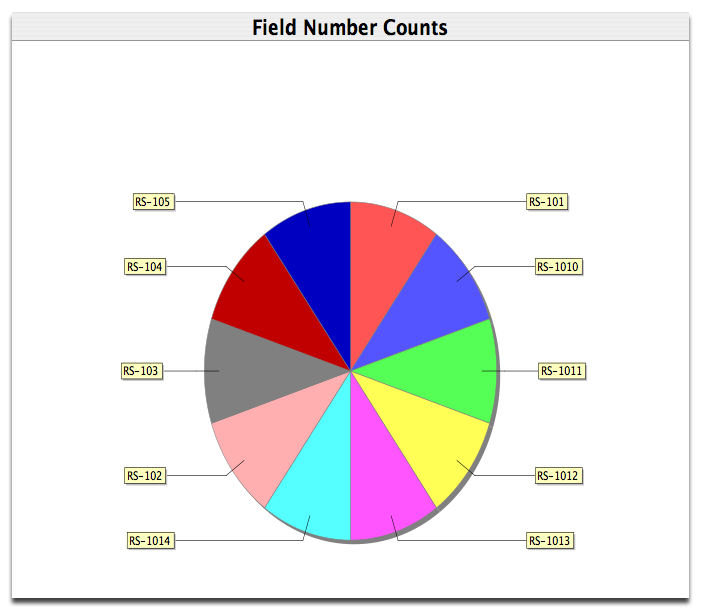
Top 10 Report