Charts
The Chart report creates a graphic display of the counts of all the unique values for a single column (a graphical display of the Data Set Summary report). These graphs may not display correctly when large numbers of unique values are presented.
The easiest way to create this report is to 'drag and drop' a Data Set onto the Chart action on the sidebar. This eliminates the need to choose a Data Set for the report.
Or, click the Chart action on the side bar. A file dialog will appear to choose a Data Set for the report.
Next, choose a field for the report:
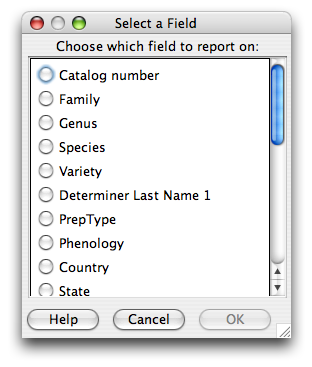
Select a Field
Select a column and click 'OK'. The report will open in the work space.

Chart Report